There are two other transformations, but they’re harder to “see” with any degree of accuracy.
The first of these transformations is multiplication on the entire function. To see what this looks like, compare the graphs of 2 × f (x) = 2x2, f (x) = x2, and ½ × f (x) = (½) x2, below:
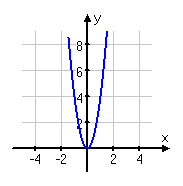
graph of 2 × f (x) = 2x2 :
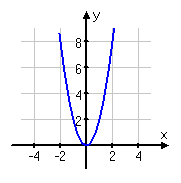
(This is skinnier than the regular function’s graph, in the box below.)
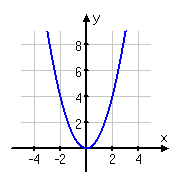
graph of f (x) = x2 :
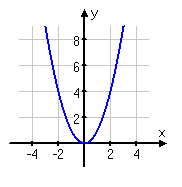
(This is the graph of the regular function.)
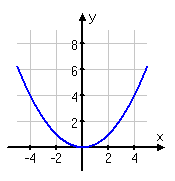
graph of ½ × f (x) = (½)x2 :
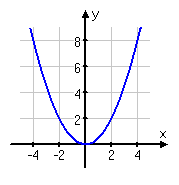
(This is fatter than the graph of the regular function, which was shown in the previous box.)
The first parabola, the one for 2x2, grows twice as fast as x2 (the middle graph), so its graph is tall and skinny. On the other hand, the third parabola, the one for the function (½) x2, grows only half as fast as x2, so its graph is short and fat.
You can tell, roughly speaking, that the first graph, being skinnier, is multiplied by something bigger than 1 so it grows faster than is standard, and that the third graph, being squatter, is multiplied by something smaller than 1, so it grows slower than is standard. But it is generally quite difficult to tell exactly what a graph has been multiplied by, just by looking at the picture.
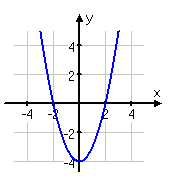
For instance, can you tell that the graph below shows 1.4 × f (x) = 1.4x2?
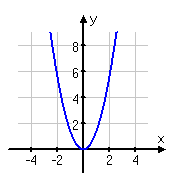
Not likely.
The other more-difficult type of transformation is multiplication on the argument of the function. It often looks very similar to multiplication on the entire function. For instance, consider the graphs of f (2x) = (2x)2, f (x) = x2, and f (½ x) = (½ x)2, below:
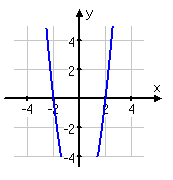
graph of f (2x) = (2x)2:
(This graph grows twice as quickly as does the graph of the regular function, shown in the next box.)
graph of f (x) = x2:
(This is the graph of the regular function.)
graph of f (½ x) = (½ x)2:
(This graph grows only half as fast as does the graph of the regular function, shown in the previous box.)
As you can see, multiplying inside the function (inside the argument of the function) causes the graph to get thinner or fatter. This looks a lot like the other multiplication transformation, but this transformation is multiplication outside, or on, the whole function. And it is usually just about impossible to identify this transformation from a graph or to distinguish it from the other multiplicative transformation.
Sometimes, though, it helps to look at the zeroes of the graph (if it has more than one) or turning points, as they will be spread further out (if the argument is multiplied by something larger than 1) or bunched up toward the y-axis (if the argument is multiplied by something smaller than 1).
For instance, looking at y = x2 – 4, you can see that multiplying outside the function doesn’t change the location of the zeroes, but multiplying inside the function does:
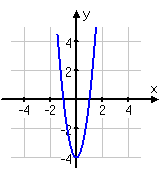
graph of x2 – 4:
(This is the graph of f (x), with zeroes at x = –2, 2)
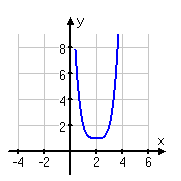
graph of 2 × f (x) = 2(x2 – 4):
(This graph is taller, but the zeroes match those of the original function, shown in the previous box.)
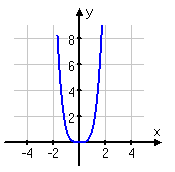
graph of (2x)2 – 4:
(Not only is this graph taller, but also the zeroes have moved inward, to x = –1, 1.)
To recap, the “left”, “right”, “up”, “down”, “flip”, and “mirror” transformations are fairly straightforward, but the “multiple” transformations, also called “stretching” and “squeezing”, can get a little messy. Just hope that they aren’t frequently required of you.
Typical homework problems on this topic ask you to graph the transformation of a function, given the original function, or else ask you to figure out the transformation, given the comparative graphs.
-
Thinking of the graph of f (x) = x4, graph f (x – 2) + 1
The graph of f (x) = x4 looks like this:
Looking at the expression for this translation, the “+1” outside the function tells me that the graph is going to be moved up by one unit. And the “–2” inside the argument tells me that the graph is going to be shifted two units RIGHT. (Remember that the left-right shifting is backward from what you might expect.)
Generally, it’s better to work from the inside out. So I’ll first move the graph to the right by two units. Then I’ll move the result up to one unit.
Then my translated graph looks like this:
When they are having you graph by moving other graphs around, they can’t be terribly critical of your drawing, since you aren’t supposed to be doing a T-chart and computing the exact points. But do try to make your graph look reasonable.
You can always “cheat”, by the way, especially if you have a graphing calculator, by quickly graphing y = (x – 2)4 + 1 and verifying that it matches what you’ve drawn. But you do need to know how to do function transformations because there are ways to ask the questions that don’t allow you to cheat, as we’ll see in the next section.